Dr. Lalitha Subramanian
About the Author
![]()
Aksharam
In this section, we shall discuss some of the major properties of a function.
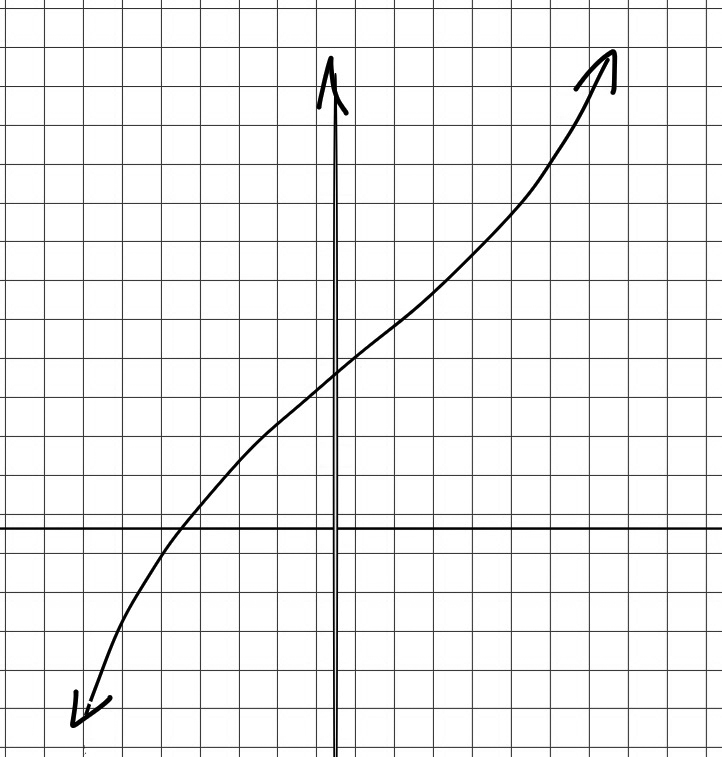
Increasing. decreasing, and constant functions A function $y=f(x)$ is increasing in an interval if an increase in the value of $x$ results in an increase in the value of $y$. That is, as $x$ increases, $y$ also increasing.
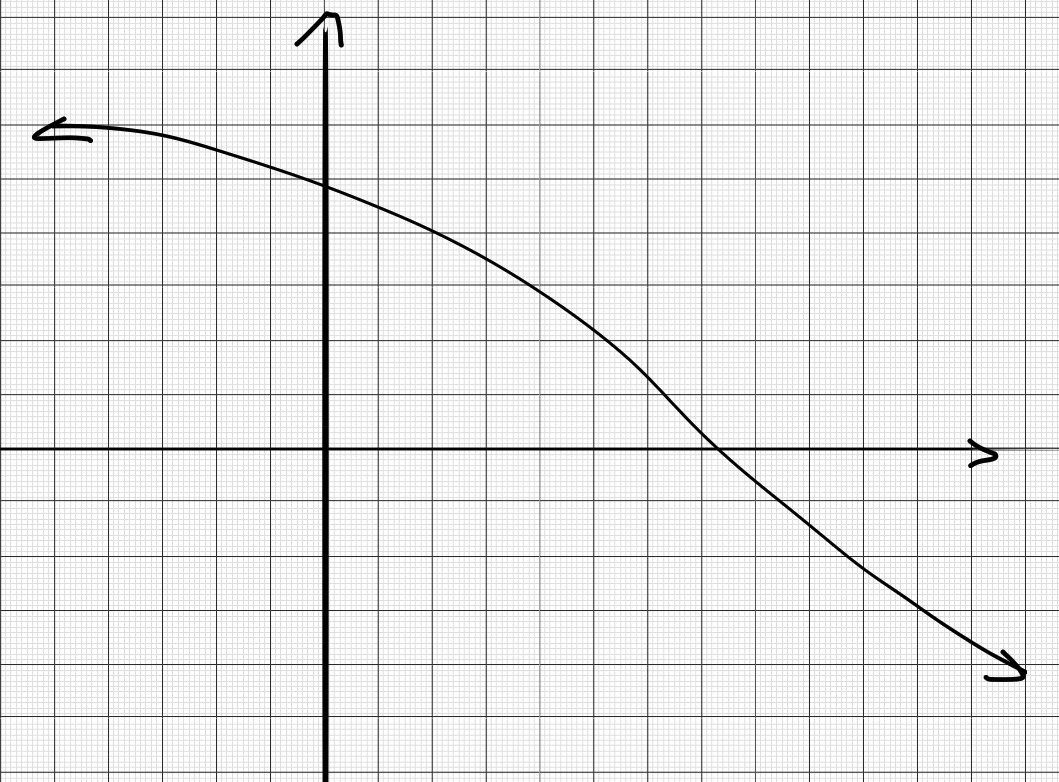
A function $y=f(x)$ is decreasing in an interval if an increase in the value of $x$ results in a decrease in the value of $y$. That is, as $x$ increases, $y$ decreases.
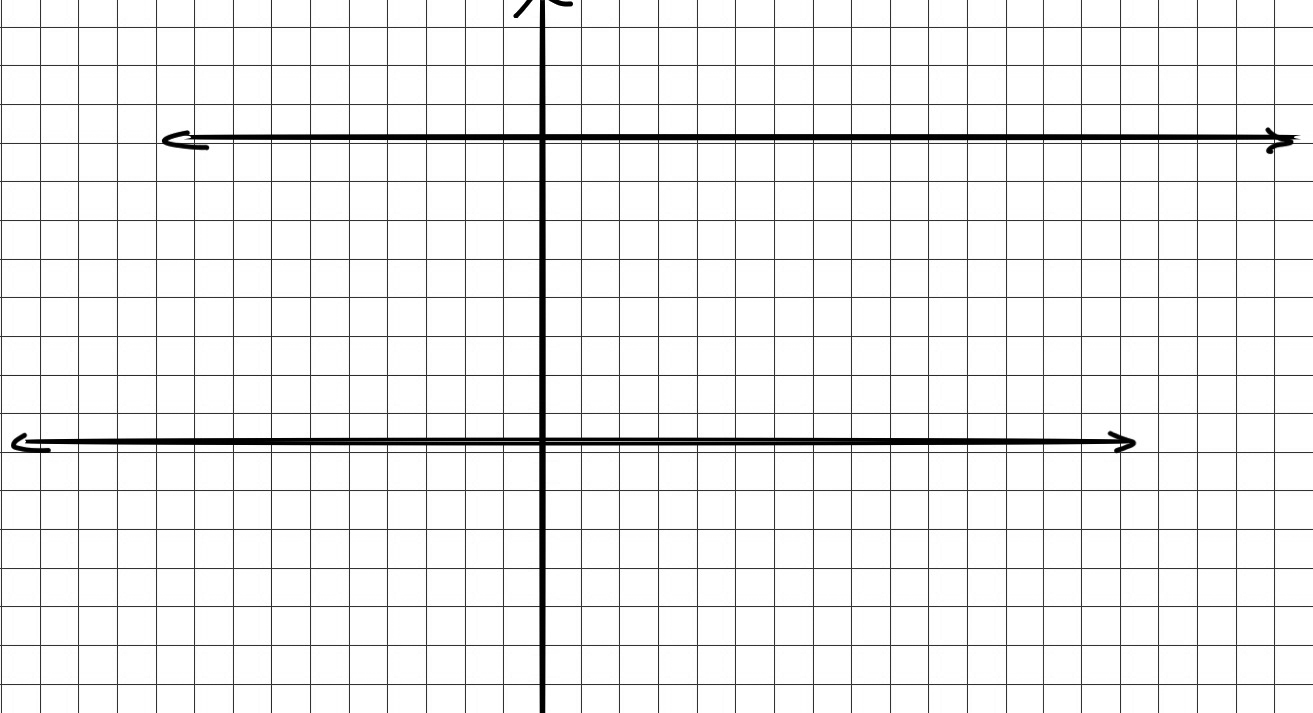
A function $y=f(x)$ is a constant function if an increase in the value of $x$ does not result in any change in the value of $y$. That is, $y$ remains constant as $x$ increases.
For each function, determine the intervals on which it is increasing, the intervals on this it is decreasing, and the intervals on which it is constant. (a) $f(x)=(x-2)^2$ (b) $f(x)=\frac{x}{x+1}$ (c) $f(x)=3$
Solution: (a) Increasing on the interval $(-\infty,2)$ and decreasing on the interval $(2,\infty)$
(b) Increasing on $(-\infty,-2)$, decreasing on $(-2, -1)$,and again decreasing on $(-1,0)$ and then increasing again on $(0,\infty)$.
(c) Constant on the interval $(-\infty, \infty)$
Continuity Logically, a function is said to be continuous at a point if there is no break or gap in the graph of the function at that point.
.jpg)
Analyze the continuity of the following functions: (a) $f(x)=x^2-4x-2$ (b) $f(x)=\frac{x^2-4}{x-2}$ (c) $f(x)=\frac{x+3}{x-2}$
Solution: (a) Continuous function
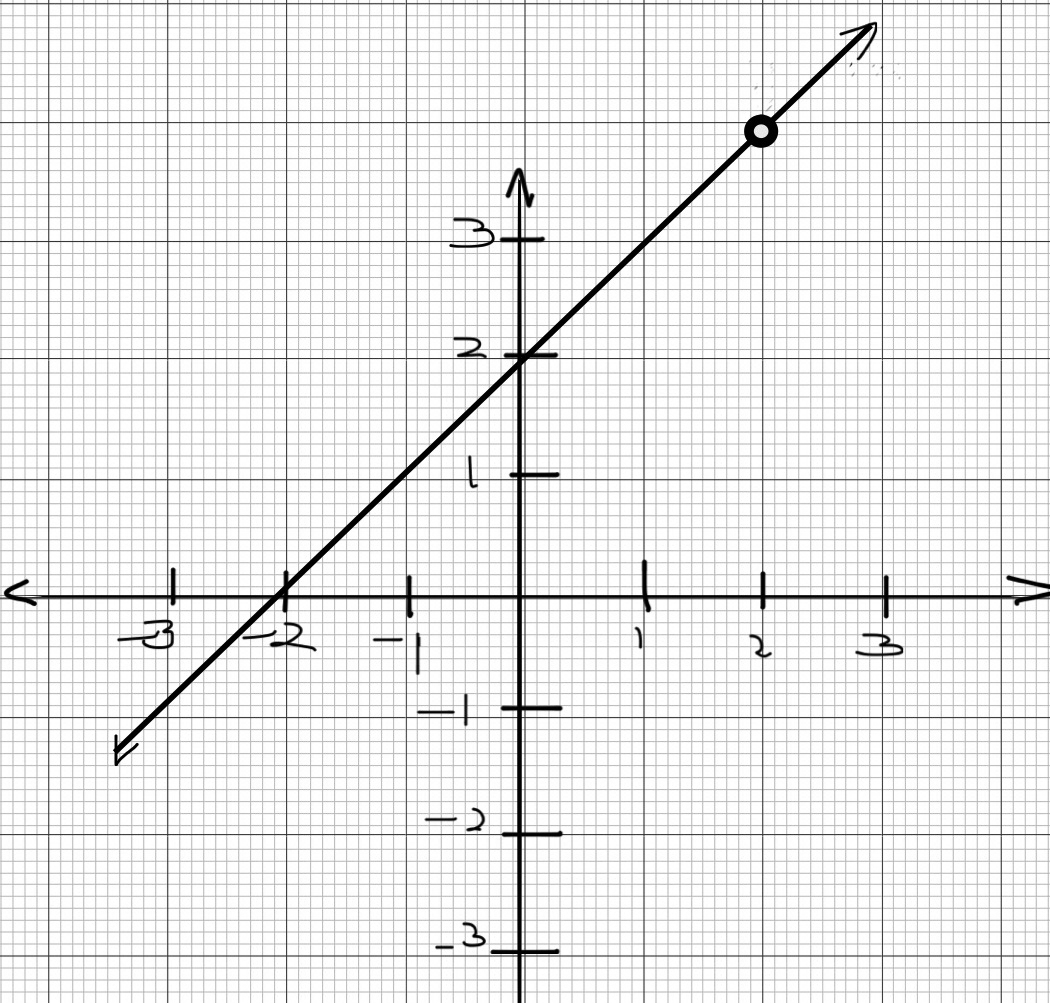
(b) Note that $x=2$ is a point of discontinuity. But, since the reduced expression
of the function gives $f(x)=x+2$, the graph of this function is stratight line, with a hole at the point $x=2$. So,there is a
removable discontinuity at $x=2$.
(c) This function has an infinite discontuity as there is a vertical asymptote for the graph of this function at $x=2$.
Boundedness A function is said to be bounded below if there is a least number $b$ in the range of the function. Then $b$ is called the lower bound of the function.
A function is said to be bounded above is there is a number $b$ which is the maximum of all the numbers in the range of the function. Then,$b$ is called the upper bound of the function.
A function is said to be bounded if it is bounded above and below. This concept is illustrated in the graphs below:
(a) This graph is bounded below.The lower bound is $y=-4$
(b) This graph is bounded above.The upper bound is $y=2$
(c) This graph is bounded. The upper bound is $y=2.5$ and the lower bound is $y=-2.5$.
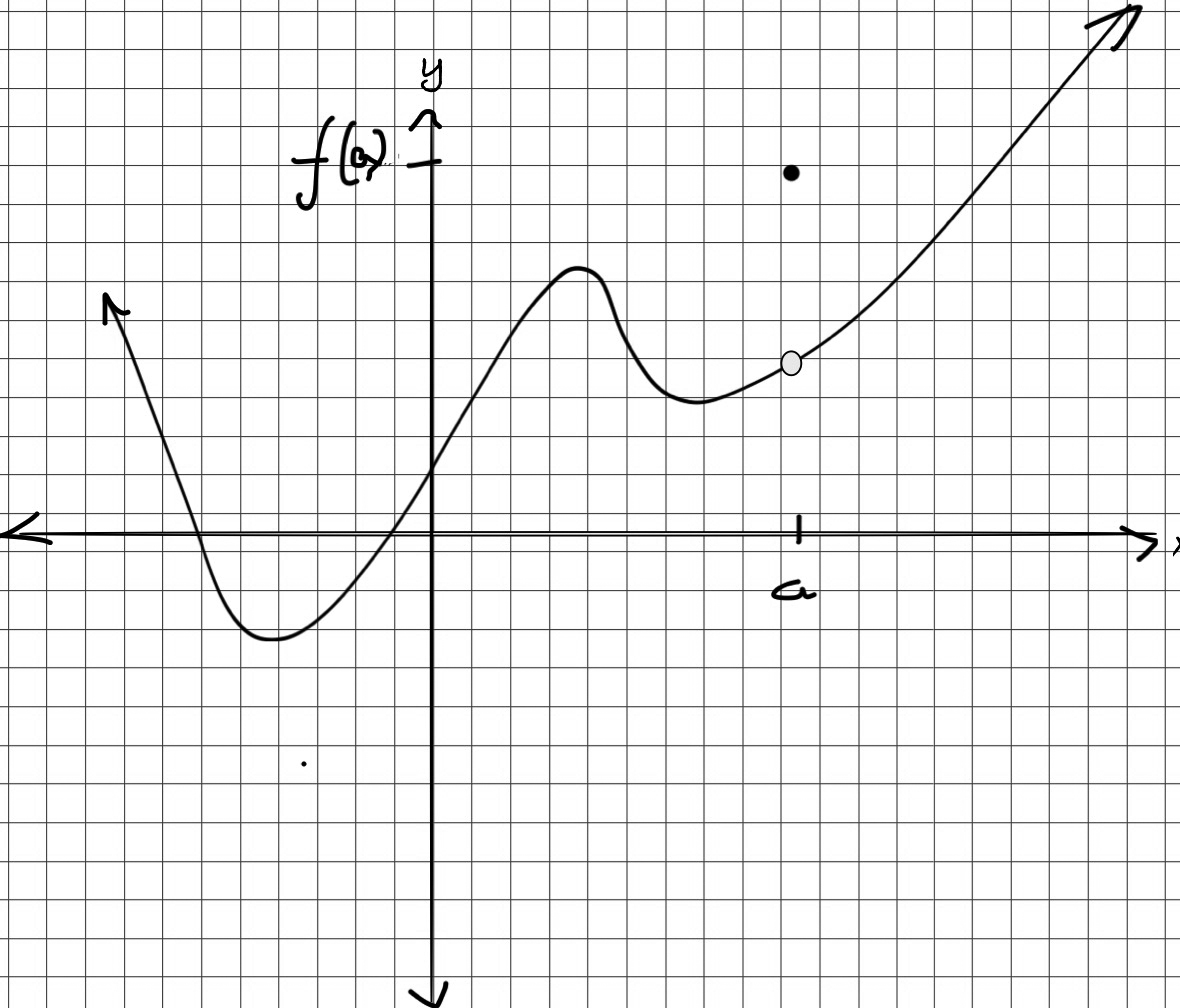
Extrema When the graph of a function changes from increasing to decreasing or vice versa at a point $x=a$, then, that point $(a, f(a))$ is said to be the local extremum of that function.
When the graph changes from increasing to decreasing then, that point is a local maximum and when it changes from decreasing to increasing,then that point is the local minimum.
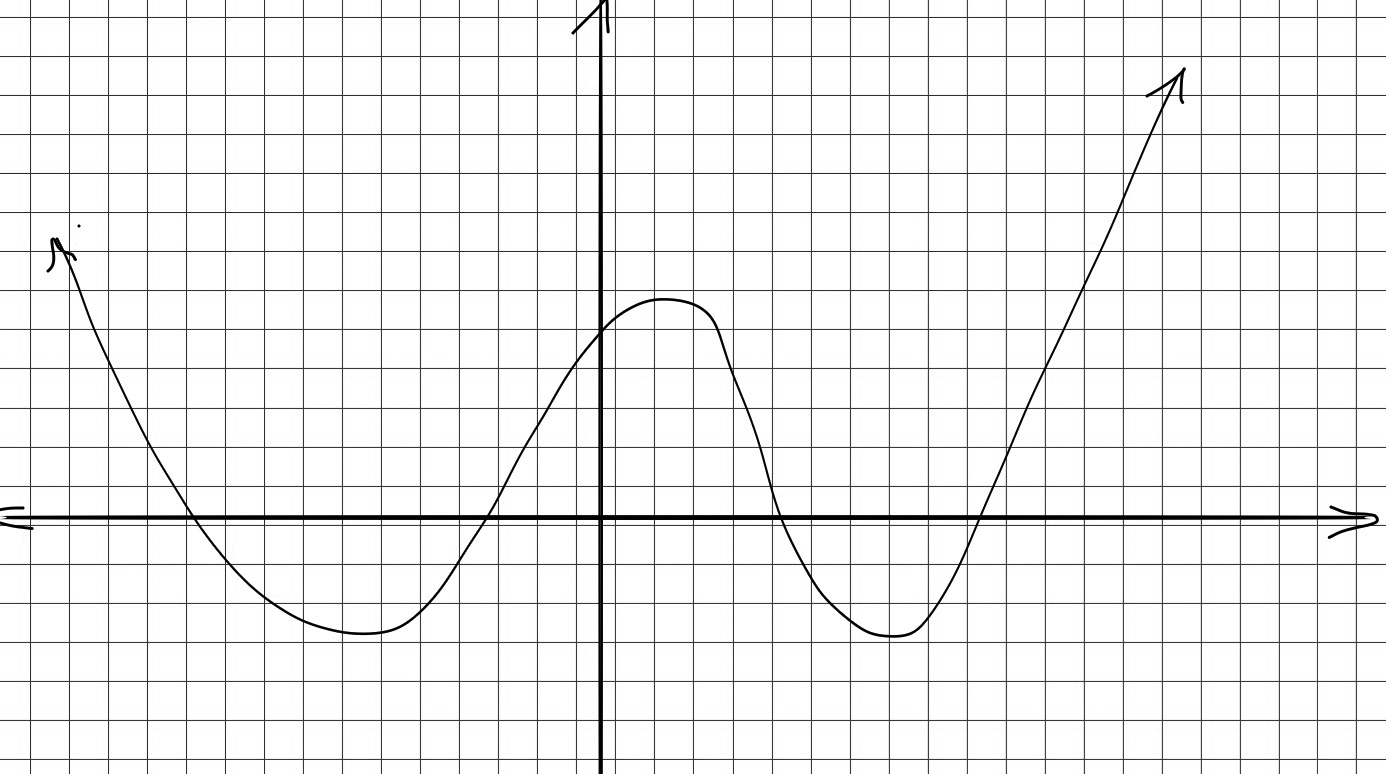
When we consider function within a closed interval, then the point where the function valus is maximum is called the absolute maximum and the point where the function value is minimum is called the absolute minimum of the function. Absolute extrema can be either the local extrema or one or more of the end points.The following two graph illustrate this property:
The above graph has two local minima, one at $x=-2.5$ and another at $x=2.1$,and a local maximum at $x=0.5$.
If we consider the graph within the interval $[-2,2]$, we see that the function has an absolute minimum at $x=-2$ and an absolute maximum at $x=0.5$.
Symmetry In mathematics, 'a figure is symmetric about a line' implies that the two parts of the figure divided by that line are exactly alike or identical. One part will the mirror image of the other part, is a mirro is kept on that line.The line is called axis of symmetry. We discuss three main types symmetry here.
Consider the function $f(x)=x^4-2x^2+3$. This is an even function. If we substitute $(-x)$ for $x$ in $f(x)$, we get \begin{eqnarray} f(-x) &=& (x)^4 -2(-x)^2+3\\ &=& x^4 - 2x^2+3\\ &=& f(x)\\ \end{eqnarray}
This function is symmetric with respect to the $y$-axis. Graphically, we notice that the portion of the graph to the right of the $y$-axis is exactly same as the portion to left of the $y$-axis.
Consider the graph of $y^2=4x+1$. algebraically, if we can verify that $(x,-y)$ also satisfies this equation. The graph below shows that any vertical line crosses the graph in more than one point. so, this is not a function.
Consider the function $y=x^3-3x$. The graph below shows that it has rotational symmetry about origin. Also, is we substitute $-x$ for $x$, we note that \begin{eqnarray} f(-x) &=& (-x)^3 - 3(-x) \\ &=& -x^3 + 3x\\ &=& -(x^3-3x)\\ &=& -f(x)\\ \end{eqnarray}
Check the following functions for symmetry: (a) $f(x)=x^2-3$; (b) $f(x)=x^3+4x$; (c) $f(x) = x^4-3x+2$
Solution: (a) Checking algebraically: \begin{eqnarray} f(-x) &=& (-x)^2-3 \\ &=& x^2-3\\ &=& f(x)\\ \end{eqnarray} So, this is an even function. The graph is symmetric with respect to $y$-axis. The graph below confirms this.
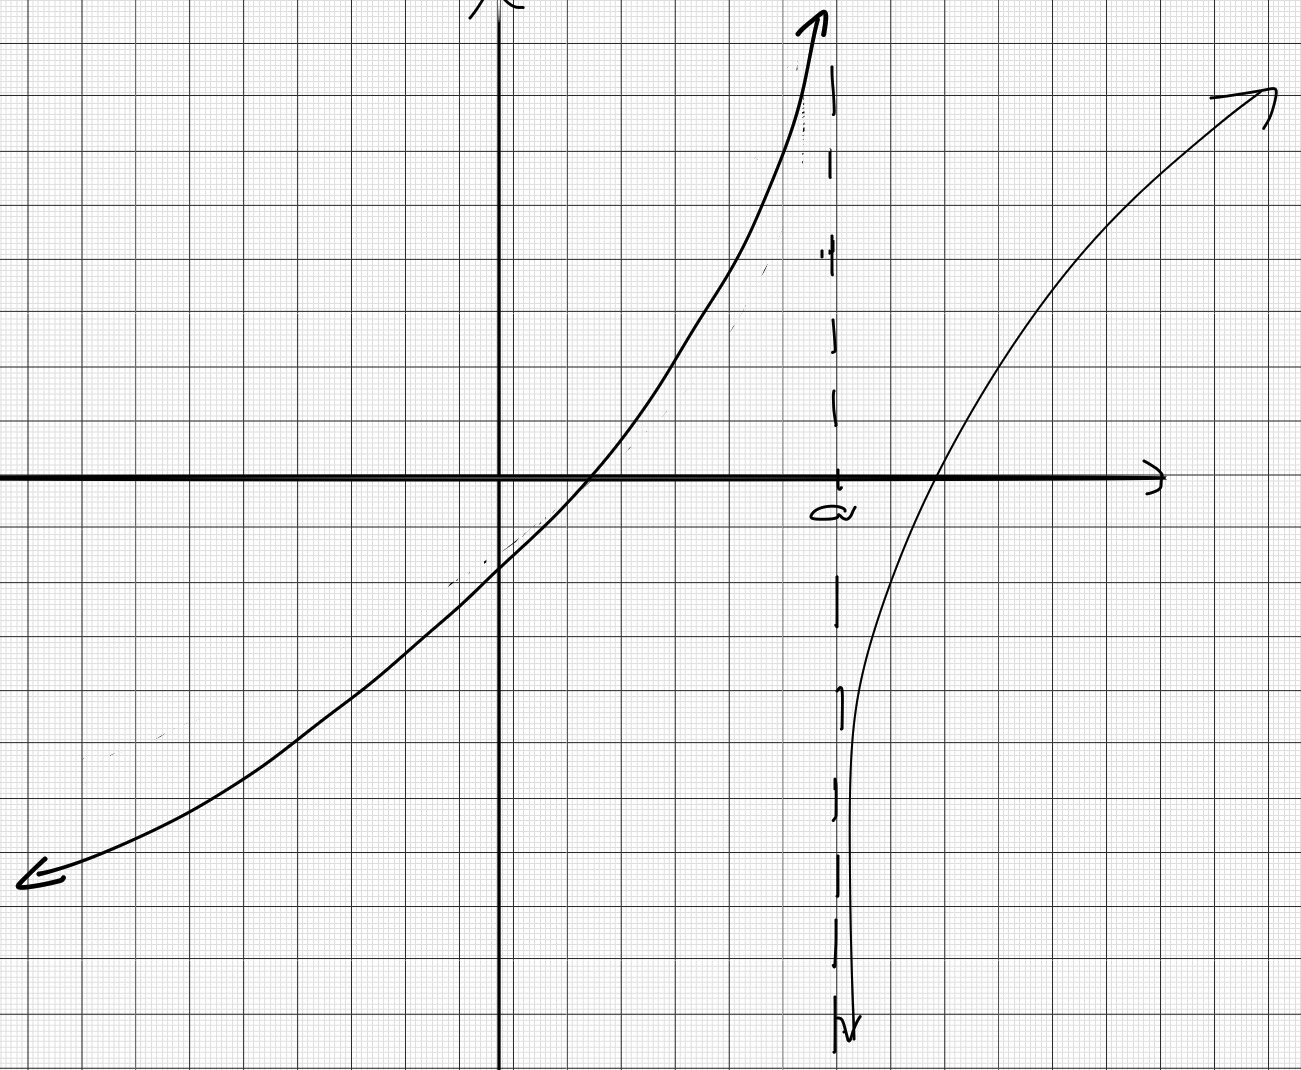
Asymptotes Asymptotes are lines that describe the behavior of a graph as they approach the line. A line $y=f(x)$ is an asymptote to a graph of a function if the graph tends to come closer and closer to the line but does not cross it. In other words, the graph tends to $\infty$ or $-\infty $ when it approaches the line. Such asymptotes can be horizontal, vertical or oblique lines. A graph can have more than one vertical asymptote, but it can have only one, or none, horizontal asymptote. This is because of the basic definition of a function.
The graph below has $y=-1$ as a horizontal asymptote and $x=-2$ and $x=2$ are two vertical asymptotes.
In particular, a vertical line $x=h$ is a vertical asymptote of the graph of a function $y=f(x)$ is $f(x)$ approaches the line $x=h$ as $x$ approaches $+\infty$ or $-\infty$. A horizontal line $y=k$ is a horizontal asymptote of the graph of a function $y=f(x)$ if $f(x)$ approaches the line $\pm \infty$ as $x$ approaches $y=k$.
Identify the horizontal and vertical asymptotes of the graph of the following function:
Solution:The graph has two vertical asymptotes, one at $x=-1$ and another at $x=2$. It has a horizontal asymptote at $y=0$.
For problems # 1 - 4, determine whether or not the graph of the given function has a discontinuity. If there is a discontinuity, state the point of discontinuity and the type of discontinuity.
Infinite discontinuity at $x=1$
No discontinuity
One removable discontinuity at $x=0$.
One removable discontinuity at $x=-3$
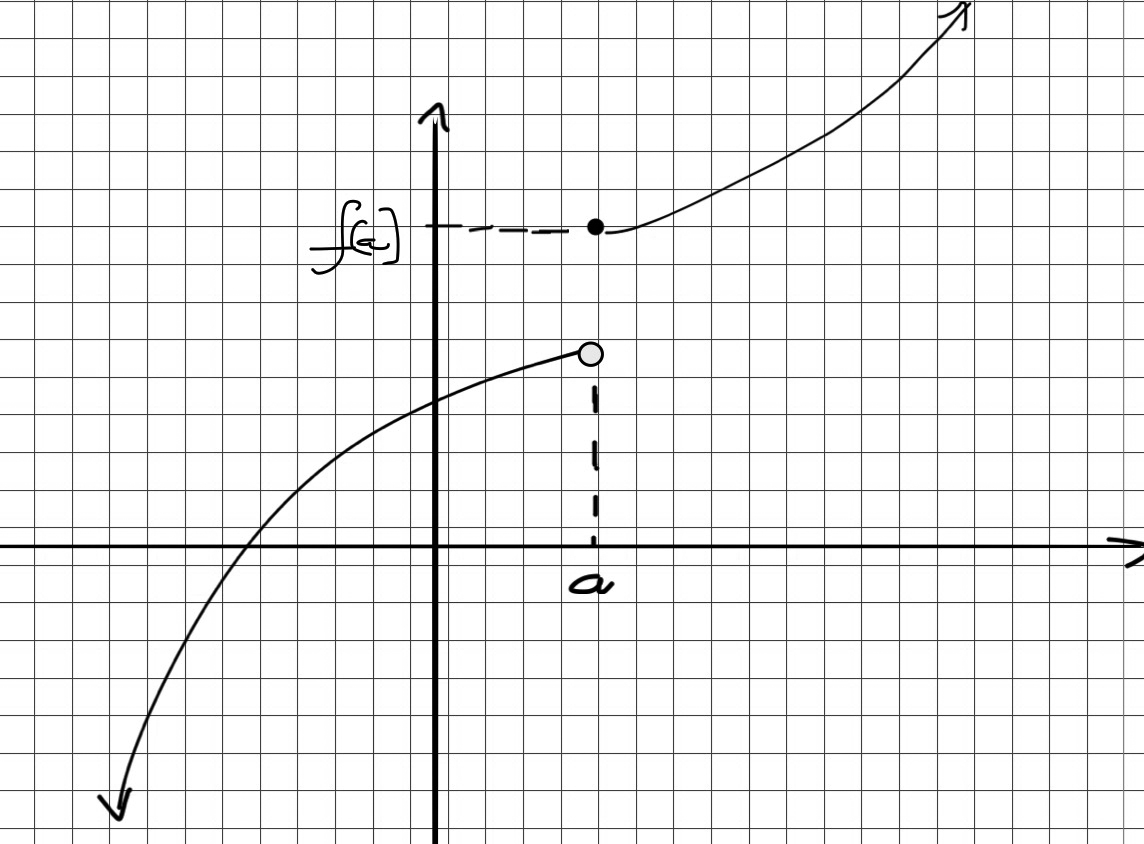
For problems #5 and #6, identify the type of discontinuity
Jump discontinuity
Removable discontinuity
For problems #7-10, identify whether each labelled point is a local maximum, a local minimum, or neither. Also, determine the intervals where each graph is increasing, decreasing, and constant.
Local minimum at $(-2.2, -2.8)$ and local maximum at $(2.7,3)$.
Local maximum at $(1,4)$ and local minimum at $(4,-1)$.
Local maximum at $(2,1)$.
Local minimum at $(4,-1)$.
For problems #11 - 13, determine whether the function is bounded above, bounded, or bounded on its domain. Also state the bounds.
Bounded above by the point $(0,1)$. So,the upper bound is $y=1$
Bounded below by the point $(-1,0)$. Lower bound is $y=0$
Bounded on its domain. Upper bound is $y=3$ and lower bound is $y=0$.
For problems #14-16, state whether the function is even, odd, or neither. Also determine whether each function is symmetric with respect to the $y$-axis, with respect to the origin, or neither.
Odd function. The graph is symmetric with respect to the origin.
Even function. Symmetric about $y$-axis.
Neither even nor odd. Not symmetric.
For problems #17-20, find the equations of the horizontal and vertical asymptotes.
Horizontal asymptote $y=1$; Vertical asymptote $x=3$.
Horizontal asymptote $y=2$ and two vertical asymptotes $x=-1$ and $x=1$.
No horizontal asymptote. One vertical asymptote $x=-1$.
Horizontal asymptote $y=0$. Vertical asymptote $y=2$.
Horizontal asymptote $y=0$. Vertical asymptote $y=2$.
Horizontal asymptote $y=0$. Vertical asymptote $y=2$.
Horizontal asymptote $y=0$. Vertical asymptote $y=2$.
Horizontal asymptote $y=0$. Vertical asymptote $y=2$.